How I Used PostHog to Add Observability to My Web App as a Junior DevOps Engineer
How I Used PostHog to Add Observability to My Web App as a Junior DevOps Engineer
Introduction
When I deployed TongueFlow — my AI-powered teleprompter web app — I quickly realized that shipping the product was only half the battle. The moment real users started arriving, a flood of questions hit me:
- Where are my users coming from?
- Are they on mobile or desktop?
- How many pages do they actually visit before leaving?
- Which referral channels are driving the most traffic?
As a junior DevOps engineer, I knew I needed observability — not just for infrastructure, but for the product itself. That's where PostHog came in.
In this post, I'll walk you through how I set up PostHog for TongueFlow and what the data revealed in the first week after launch.
What Is TongueFlow?
Before diving into the analytics, let me quickly explain the app. TongueFlow is a free, browser-based AI teleprompter designed for YouTubers, educators, corporate presenters, and podcasters. It uses a cloud-powered AI transcription engine to listen to your voice in real-time and automatically scroll your script to match where you are — no manual speed dials, no hardware needed.
Key highlights:
- Real-time voice tracking with 92% accuracy
- No install — runs entirely in the browser
- Skip detection — if you jump ahead in your script, the AI follows
- Session history — track your accuracy over time
After deploying it at tongueflow.com, I needed a way to understand how real users were interacting with it.
Why PostHog?
I evaluated a few analytics tools, but PostHog stood out for several reasons:
| Criteria | PostHog | Google Analytics |
|---|---|---|
| Open Source | ✅ Yes | ❌ No |
| Self-hostable | ✅ Yes | ❌ No |
| Privacy-friendly | ✅ Yes | ⚠️ GDPR concerns |
| Product analytics | ✅ Built-in funnels, retention, paths | ⚠️ Limited |
| Session recordings | ✅ Included | ❌ Requires separate tool |
| Free tier | ✅ Generous (1M events/mo) | ✅ Free |
As someone with a DevOps mindset, I appreciated that PostHog is open-source and can be self-hosted if needed. For now, I'm using the cloud version, which was perfect for getting started quickly.
Setting Up PostHog
Integration was straightforward. PostHog provides a JavaScript snippet that you drop into your app. For a web application, it's as simple as:
!function(t,e){var o,n,p,r;e.__SV||(window.posthog=e,e._i=[],e.init=function(i,s,a){function g(t,e){var o=e.split(".");2==o.length&&(t=t[o[0]],e=o[1]),t[e]=function(){t.push([e].concat(Array.prototype.slice.call(arguments,0)))}}(p=t.createElement("script")).type="text/javascript",p.crossOrigin="anonymous",p.async=!0,p.src=s.api_host+"/static/array.js",(r=t.getElementsByTagName("script")[0]).parentNode.insertBefore(p,r);var u=e;for(void 0!==a?u=e[a]=[]:a="posthog",u.people=u.people||[],u._i.push([i,s,a]);0<u.length;)g(u,u.shift());e._i.push([i,s,a])})}(document,window.posthog||[]);
posthog.init('<YOUR_PROJECT_API_KEY>', {
    api_host: 'https://us.i.posthog.com',
    person_profiles: 'identified_only'
});
Once deployed, PostHog starts capturing pageviews, sessions, and user interactions automatically — no extra instrumentation needed for the basics.
What the Data Revealed: First Week After Launch
After the first week with PostHog running on TongueFlow, the results were both exciting and insightful. Let me walk through the key dashboards.
Web Analytics Overview
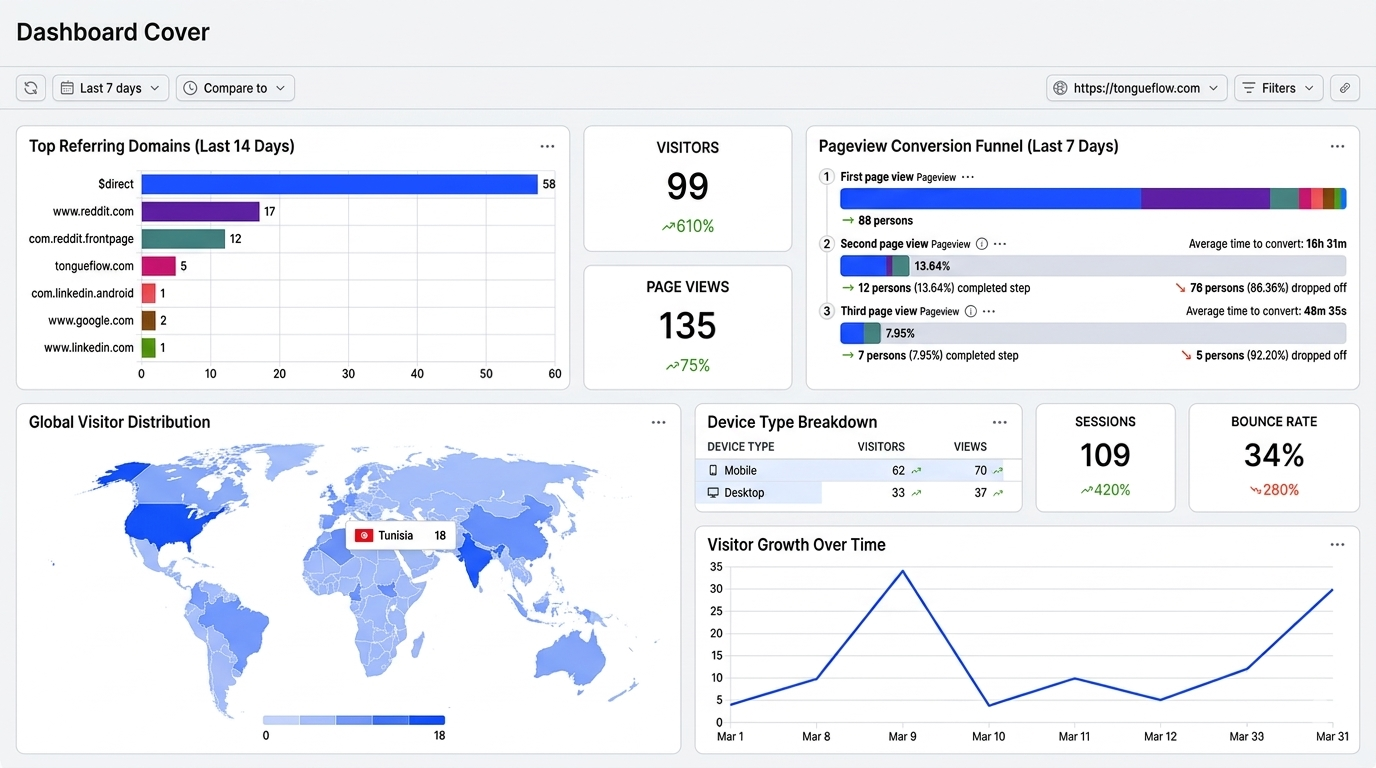
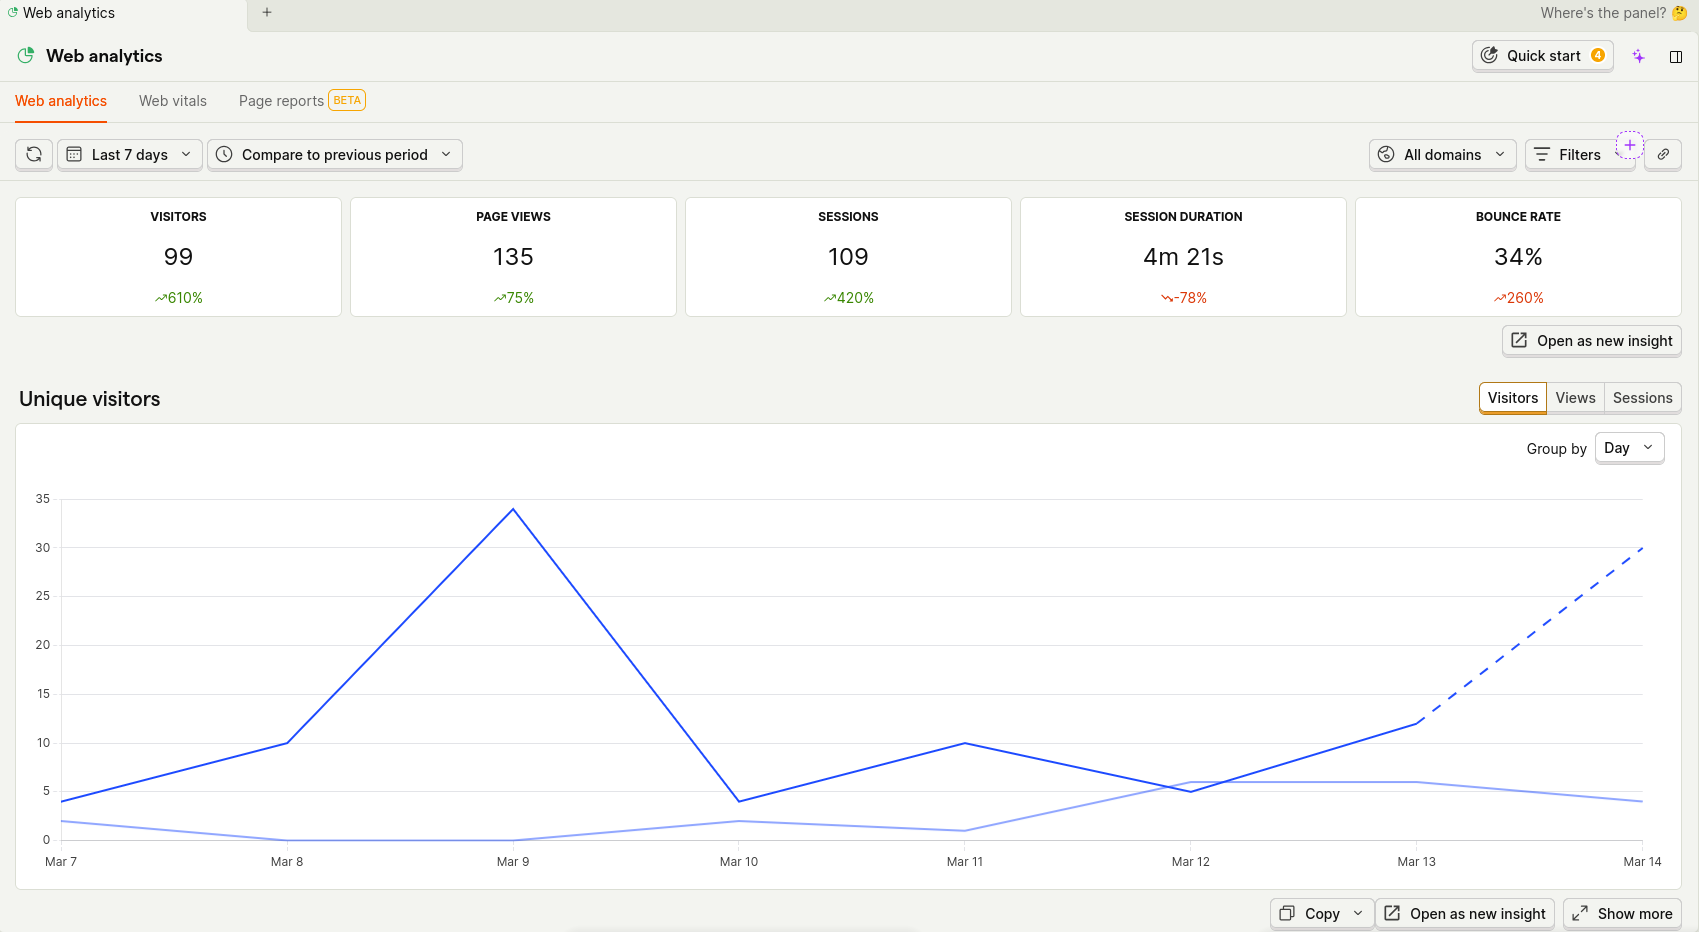
The first thing I check every morning is the Web Analytics dashboard. Here's what the first 7 days looked like:
The numbers that jumped out:
- 99 unique visitors — up 610% compared to the previous period
- 135 page views across 109 sessions
- 4 min 21s average session duration — users were actually spending time exploring the app
- 34% bounce rate — a healthy number, meaning most visitors engaged beyond the landing page
The visitor trend chart shows a clear spike around March 8–9, which correlated with when I shared TongueFlow on social media.
Traffic Sources, Devices, and Geography
Scrolling down the PostHog dashboard reveals where users are coming from, what devices they're using, and which countries they live in:
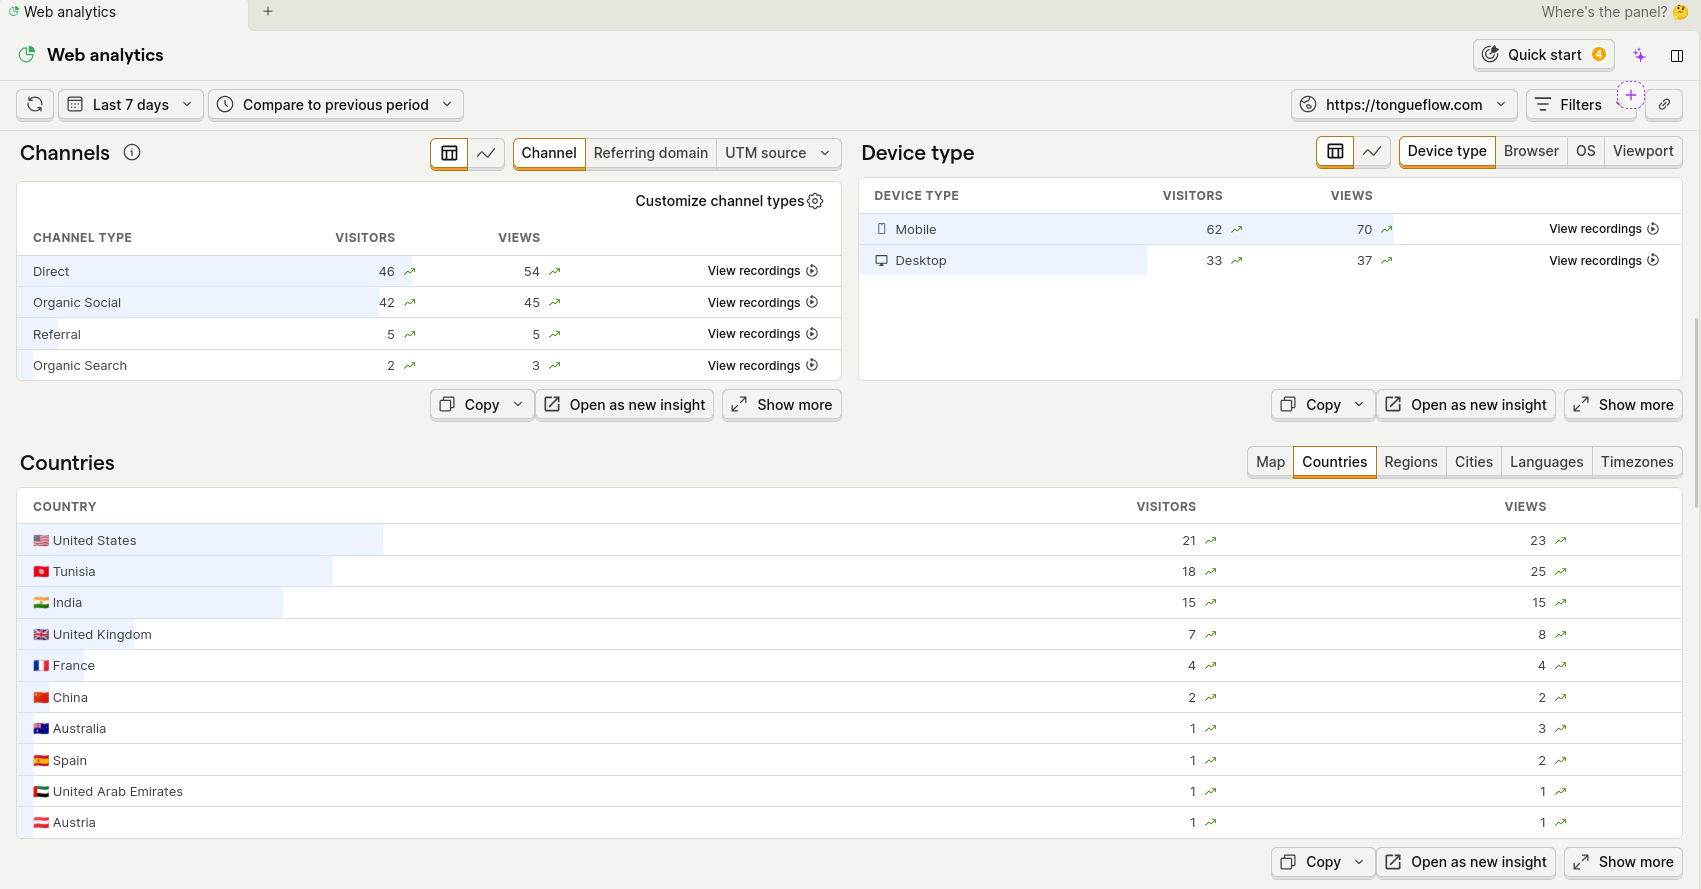
Channels Breakdown
- Direct traffic (46 visitors) — people typing the URL directly or using bookmarks
- Organic Social (42 visitors) — almost matching direct traffic, showing the power of social media
- Referral (5) and Organic Search (2) — early signs of SEO and backlinks starting to work
Device Split
- Mobile: 62 visitors (65%) vs Desktop: 33 visitors (35%)
This was a wake-up call! Nearly two-thirds of my users were on mobile. Since TongueFlow is a tool that involves reading scripts on screen, I initially designed with desktop in mind. This data pushed me to prioritize mobile UX improvements.
Geographic Reach
- 🇺🇸 United States (21 visitors)
- 🇹🇳 Tunisia (18 visitors)
- 🇮🇳 India (15 visitors)
- 🇬🇧 United Kingdom (7 visitors)
- 🇫🇷 France (4 visitors)
- Plus visitors from China, Australia, Spain, UAE, and Austria
For a one-week-old app with zero paid advertising, reaching 10+ countries was genuinely exciting.
World Map View
PostHog's geographic map makes the global reach tangible at a glance:
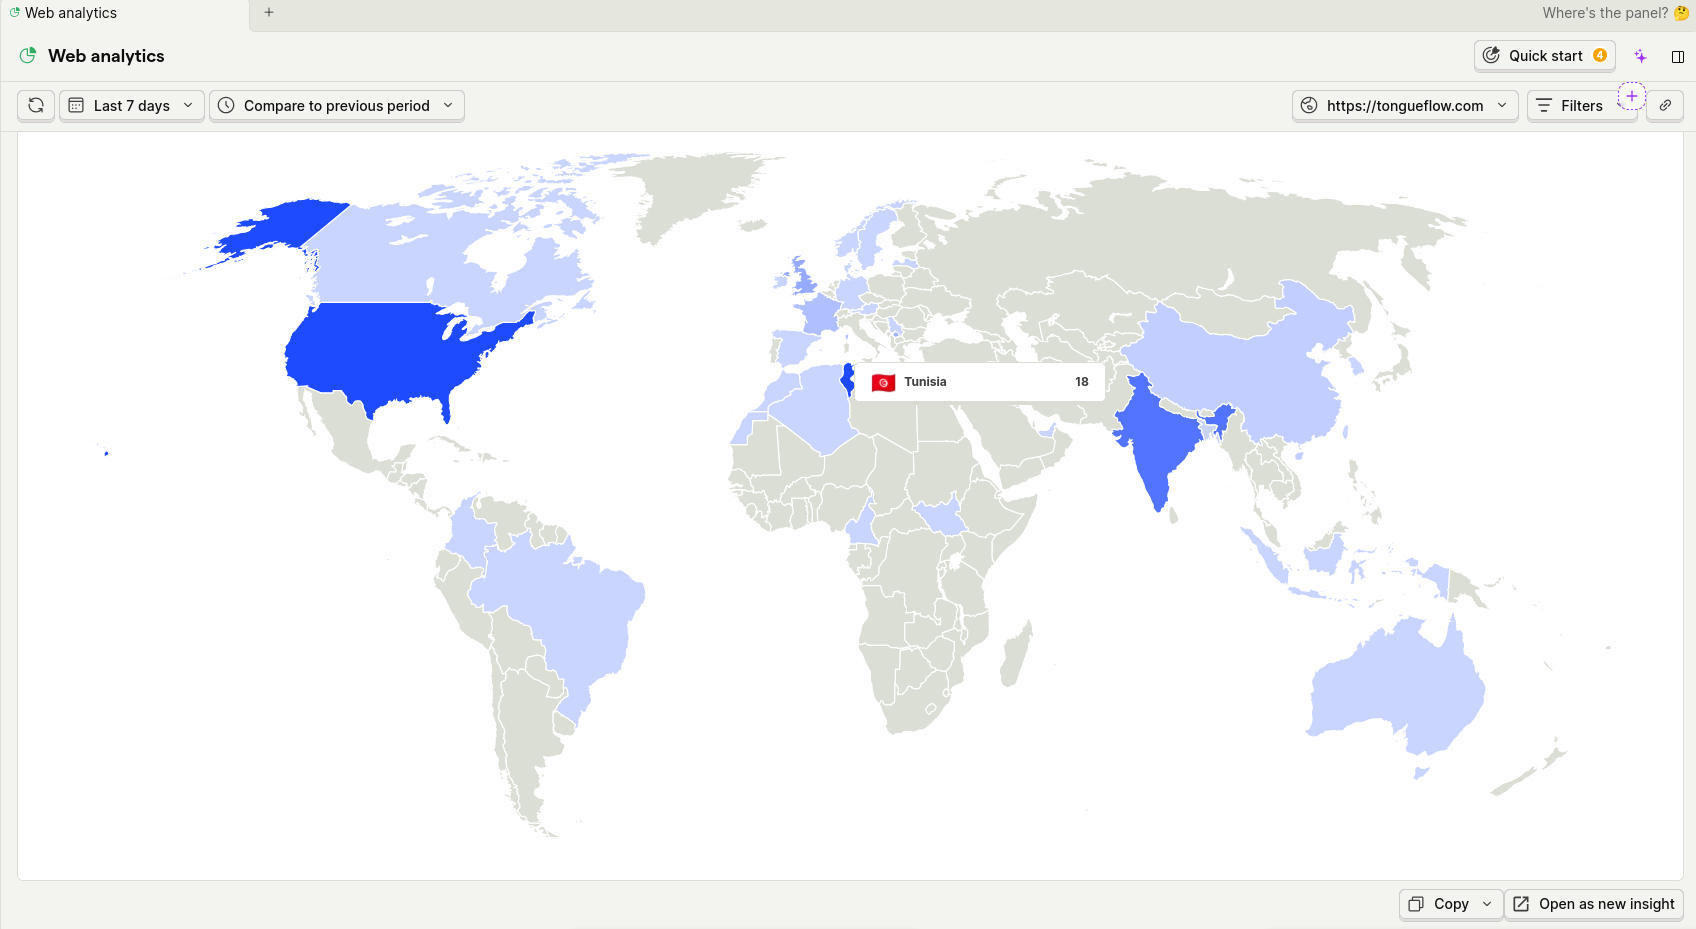
The US leads in visitor count, followed closely by my home country Tunisia, and then India. This tells me the app has global appeal and I should consider adding multi-language support sooner rather than later.
Referring Domains and Pageview Funnel
Perhaps the most actionable insight came from the referring domains chart and the pageview funnel:
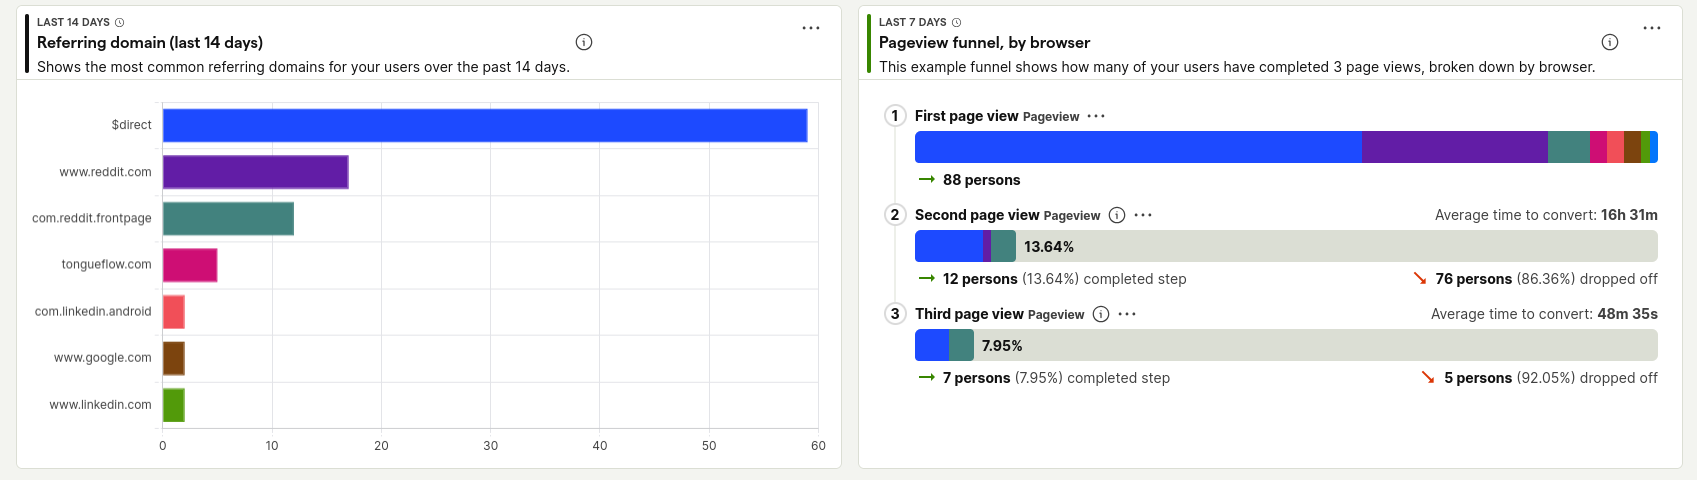
Referring Domains (Last 14 Days)
- $direct dominates with ~58 referrals
- reddit.com and com.reddit.frontpage combined account for ~25 referrals — Reddit was my biggest external driver
- tongueflow.com (internal navigation) shows up with ~8 referrals
- Small but present traffic from LinkedIn (both mobile app and web) and Google
Pageview Funnel
This funnel visualization was eye-opening:
- 88 persons hit the first pageview
- 12 persons (13.64%) viewed a second page — average time to convert: 16h 31m
- 7 persons (7.95%) viewed a third page — average time to convert: 48m 35s
This tells me that 86% of users drop off after the first page. That's my biggest area for improvement — I need to make the landing page more compelling or add clearer CTAs (calls to action) to guide users deeper into the app.
Key Lessons Learned
Here's what I took away from this experience as a junior DevOps engineer:
1. Observability Isn't Just for Infrastructure
As DevOps engineers, we tend to think about monitoring in terms of CPU usage, uptime, and error rates. But product observability — understanding how users interact with your app — is equally important. PostHog bridges that gap.
2. Data Drives Priorities
Before PostHog, I would have guessed most users were on desktop. The data showed the opposite. Without this insight, I would have been optimizing for the wrong audience.
3. Small Apps Benefit Most from Analytics
You might think analytics is only for apps with millions of users. In reality, when you have fewer than 100 users, every data point matters more. A single referring domain or a geographic cluster can shape your entire roadmap.
4. Reddit Is a Powerful Launch Channel
The referring domain data confirmed that sharing on relevant subreddits drove significant early traffic. For indie developers and side projects, Reddit is underutilized.
5. Funnels Reveal the Real Problems
High bounce rates and drop-offs are not "bad" — they're information. The funnel showed exactly where users are losing interest, giving me a clear target for the next iteration.
What's Next
Based on the PostHog data, here's my action plan:
- Improve the landing page to increase the first-to-second page conversion rate
- Optimize mobile experience since 65% of traffic comes from phones
- Set up custom events in PostHog to track specific actions (e.g., starting a teleprompter session, importing a script)
- Add session recordings to watch real user interactions and identify UX friction
- Explore PostHog's A/B testing feature flags to test different landing page variants
Conclusion
PostHog gave me something that logs and uptime monitors never could: a window into how real people use my app. As a junior DevOps engineer, adding product observability to my toolkit has been one of the most valuable skills I've picked up.
If you're building a side project or managing a web app, I'd strongly recommend giving PostHog a try. It's free, open-source, and takes less than 5 minutes to set up. The insights you'll gain in the first week alone will be worth it.
And if you're curious about TongueFlow itself — give it a spin at tongueflow.com. It's free, runs in your browser, and who knows — I might be watching your session in PostHog. 😄
This post is part of my journey as a junior DevOps engineer. I write about the tools, techniques, and lessons I learn along the way. Follow me for more!